Machine Learning Can Identify Harmful Lead Service Lines & Keep Cities Healthier
About the author:
Greg Baird is a twenty-year drinking water industry veteran who now serves as the Executive Director of National Lead Service Line Inventory and Replacement at BlueConduit. He is nationally recognized as an industry leader who specializes in water infrastructure asset management, artificial intelligence modeling, and water infrastructure finance. Baird previously has served as a municipal finance officer and water utility CFO and has worked for several water engineering consulting firms and many of the top water digital solutions tech companies. At BlueConduit, Baird works with water engineering and environmental consulting firms, utilities, and water industry organizations to develop partnership strategies to improve drinking water quality. Baird can be reached at [email protected].
Lead is a neurotoxin that, as we sadly know from headlines, continues to harm communities across the United States. Though uses of lead in paint, gasoline, and pipes have been banned for several decades, lead in legacy products and materials remain in communities, posing an ongoing threat to human and economic development.
The U.S. Environmental Protection Agency (EPA) estimates there are up to 10 million residential lead service lines (LSLs) still in use in the United States directly impacting over 11,000 water utilities. And, according to the Natural Resources Defense Council, there are as many as 12 million homes across the U.S. with LSLs. The EPA’s Revised Lead and Copper Rule requires cities to develop lead service line inventories over the next two years while some states are asking for initial inventories before then. While the compliance timeline may seem long, the need is immediate for many, as the health of citizens is a matter of immeasurable importance.
Historically, funding for water infrastructure has not been a government priority, which meant cities and utilities needed to pursue tax increases or customer rate adjustments to finance water system improvements. The recently passed Infrastructure Investment and Jobs Act allocates $15 billion over five years for municipalities for lead service line removal. While these federal dollars alleviate financial barriers to remove lead service lines, many cities still face the challenge of missing or inaccurate service line records.
An actionable service line inventory is the foundation of any effective and efficient lead service line removal and replacement program. Without reliable information about service line materials, cities do not know where to direct their replacement efforts. This data gap can delay lead replacements, increase costs, and extend the amount of time residents must live with the risk of lead exposure.
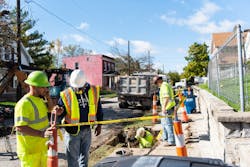
The only way to verify service line materials with 100% certainty is by completing direct condition assessments from the street all the way to the house or building. Figure 1 shows the elements in this connection. Figure 2 shows a service line replacement team at work. However, the direct assessment process at every address is cost-prohibitive and unnecessary because statistical models using machine learning can provide field teams predictions where lead service lines are most likely, resulting in high hit rates in the field.

Machine learning makes the process of identifying lead service lines much less invasive, much less costly, and more accurate by using data-driven analyses to remove the uncertainties associated with unreliable service line records.
How the Technology Works
A predictive platform characterizes lead service line probabilities on a home-by-home basis, enabling municipalities to become compliant with the EPA’s lead service line inventory requirement and expedite lead pipe removal.
The development of the predictive data model begins with a rigorous review of existing service line and parcel data to 1) generate estimates of the total number of lead service lines in the system and 2) create a data framework to produce statistically valid home-by-home probabilities.
At the outset, the statistical model uses known information (e.g., visually verified service lines, location, year built, water-main size and material, construction records, etc.) to make an initial prediction about the service line material - information that is currently unknown. Next, the city conducts service line inspections at a representative set of homes with the goal of feeding more data into the model in order to mitigate data bias and continuously improve the model’s efficacy. Figure 3 illustrates how this process unfolds.
Figure 3. Data model animation.
Once the service line data from the representative sample is combined with the existing service line data (known information), a prediction about the likelihood of lead service lines at each home with unknown service line materials is generated. A city uses these predictions to deploy targeted inspection and replacement efforts that prioritize homes with the highest risk of lead exposure.
As the city completes inspections and unknown materials become verified as lead or non-lead, the statistical model continues to integrate this new information and update its predictions. Predictions can also be translated into publicly available maps that cities use to demonstrate compliance to regulatory entities and communicate project progress to community members. An example of this map is shown in Figure 4.

Accuracy of the Predictive Model
Hit rate over time is the key metric of success for the application of machine learning to the identification of lead service lines. Hit rate is the percentage of accurate service line material predictions in the field. The higher the percentage hit rate in the field, the better for all. Hit rates must be evaluated over time. They may change as the locations most likely to have lead lines are excavated.
Table 1 shows an example of hit rates over time in BlueConduit’s lead service line replacement projects using machine learning. As local officials and engineering partners undertake lead service line replacement programs, they must evaluate the accuracy of predictive models and communicate results to constituents as a way to demonstrate success and increase transparency and accountability.
Time Period
Town 1
Town 2
Town 3
Town 4
1
52%
92%
88%
94%
2
62%
90%
84%
88%
3
75%
78%
82%
92%
4
83%
88%
88%
96%
5
81%
88%
85%
80%
6
71%
88%
84%
84%
7
71%
82%
84%
90%
8
71%
88%
84%
94%
9
70%
88%
84%
90%
10
69%
90%
86%
84%
11
78%
88%
76%
90%
Table 1. Example Hit Rates over Time in Lead Service Line Replacement Projects
BlueConduit regularly achieves hit rates of more than 80% in its replacement projects across the United States, which translates into 1) verified lead service line inventories that comply with EPA requirements and 2) lead service line replacement efforts that are efficient, cost-effective, equitable, and community-focused.Key Benefits of Machine Learning
For all utilities, proactively addressing water quality and the potential of lead service lines is an issue of public trust between the local government and individual households. Cities, and by extension, water utilities, need to be equipped with the information needed to identify where lead service lines are and develop a safe removal plan while equitably protecting public health.The EPA is requiring cities to complete lead service line inventories by October 2024. What could be considered a daunting task, can be made less arduous through the use of machine learning. BlueConduit’s statistical models have hit rate accuracies of greater than 80%, and this data-driven approach to creating lead service line inventories reduces cost, increases efficiency, increases equity, and builds healthy, thriving communities.
Why Use Statistical Models with Machine Learning to Inventory and
Replace Lead Service Lines?
Reduce Cost
Increase Efficiency
Maximize water utility budgets and state and federal funding by avoiding unnecessary or non-lead service line digs, which can range widely with cities estimating between $6,000 and even $15-26K per dig (citation).
Keep water affordable for consumers by controlling inventory and replacement costs and eliminating the possibility of rate increases.
Reduce the amount of time it takes to audit data and validate lead service lines.
Integrate water, sewer, meter, and street infrastructure repairs and replacement projects with lead service line removal.
Increase Equity
Build Healthy, Thriving Communities
Educate the community about the risk of lead poisoning and transparently communicate the materials used in service lines.
Identify which communities and households are in greatest need of intervention and distribute resources accordingly.
Increase trust and communication with neighborhoods.
Reduce community disruption by limiting the number of service line inspection digs.
Decrease the amount of time households live with the danger of lead exposure.
Introduce water safety measures (e.g., water filter distribution) to reduce potential lead exposure before excavation begins.