Using data to fine tune Arlington’s wastewater treatment
The Trinity River Authority (TRA) manages four water and five wastewater treatment plants within the Trinity River Basin — an area of about 18,000 square miles that stretches over 17 counties in Texas.
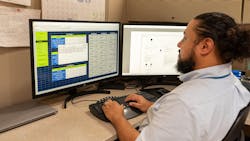
The authority uses a water information management system (WIMS) for regulatory and compliance reporting, as well as data repository for water quality information and analysis. By pulling in data from the supervisory control and data acquisition (SCADA), laboratory reports and asset management systems, operators can make informed decisions to ensure the water treatment process is on track and that chemical usage and power consumption are optimized.

Maintaining compliance
Wastewater treatment is a difficult process, with each facility containing hundreds of internet protocol-enabled assets and thousands of data points that report continuously. Regulation and oversight of the treatment process are important aspects of environmental protection and public health. As water regulations continue to evolve, water and wastewater treatment plants often struggle to manage the mountains of data required to keep up with compliance and efficiently operate the facility.
Previously, the authority would collect data in several disparate forms and manually compile it. The process was slow and prone to error.
“Regulatory data was collected in all forms — SCADA and LIMS interface, paper and manual data entry,” said David Naranjo, WIMS systems administrator for TRA. “During reporting periods, managers would then export this data and copy it into an Excel workbook that would then need to be compiled and reviewed. This manual process would take them a few days to perform and didn’t have many safeguards to mitigate against errors introduced by personnel (human factors). Sometimes, facilities would have to work right up to the deadline for submitting reports. This was one of the biggest hurdles we needed to overcome and why using a more modern system like WIMS made the most sense.”
Creating manual reports using Excel is time-consuming and many of the tasks needed to create compliance reports are redundant. In 2021, it took an annual total of 288 man-hours to complete monthly regulatory reporting. After transitioning to a water information management system (WIMS) in 2022, it only required three annual total man hours — a 99% reduction.
Collecting data at the source and entering variables into WIMS eliminates the number of times the data needs to be handled to get it into the system. The software provides an audit trail, and the data can then be used in different reports across the system.
“This is particularly helpful to mitigate human error and a significant time saver for regulatory reporting,” said Naranjo.
Instead of a days-long process, automated reporting is now done from WIMS in 15 minutes on average.
The power of automated data collection
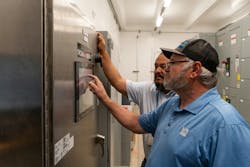
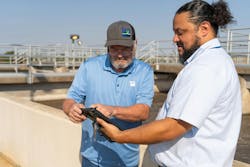
To automate and streamline data collection, TRA uses iFix to extract data from SCADA, LabWare to collect laboratory data, and Maximo in conjunction with the Maximo mobile app for operator inspections. This allows operators performing inspections to input the data directly in the field so they no longer have to write results on a piece of paper and enter it into Excel.
Before transitioning to a water information management system, TRA’s Ten Mile Creek Regional Wastewater System (TMCRWS) plant consumed 6,516 sheets of paper annually to capture process control and laboratory data. Since implementation, the usage has dropped to approximately 100 sheets, representing a 98% reduction in annual paper consumption.
Reducing the number of human interactions eliminates the possibility of human error and frees up time for operators to focus on operational efficiencies. Data within WIMS can be organized by each physical location, which creates a digital twin of the plant.
The convergence of the physical and digital realms yields precise, real-time performance insights. This has given operators a better understanding of the treatment process and the ability to make better operational decisions.
Having all the data easily accessible in one place and archived over the years also opens the door to trend analysis and finding causality between different elements. For example, if dissolved oxygen (DO) levels drop in a basin, it can cause a spike in ammonia in the discharged effluent. Inversely, a high DO can indicate opportunities for energy cost savings by trimming the amount of air being generated by the blowers. The dashboard allows operators to be proactive in maintaining healthy DO level while lowering costs.
“Recently the chief operator noticed a trend in SCFM (standard cubic feet per minute) and basin DO levels on the dashboard,” Naranjo said. “This led him to make the decision to turn off one of the blowers. In doing so, he maintained safe DO levels and was able to realize a significant savings in electrical power.”
By using the dashboards, TMCRWS operators can continuously fine-tune blowers and ultraviolet system power settings. This enables them to proactively maintain DO levels and allow for adequate effluent disinfection while reducing energy consumption. Despite the digital twin implementation occurring halfway through fiscal year 2022, TRA realized $55,000 in savings within a six-month period.
Another example of causality that the dashboard brought to light was when operators noticed an abnormal increase in the secondary clarifier torque level. This led to a proactive inspection of the clarifier which revealed a twisted rake arm and ultimately averted a potential outage and a $400,000 catastrophic repair.

Driving treatment processes from a dashboard
Several advancements in water reuse and recycling technologies and practices can help conserve water and reduce wastewater discharge, but only with timely access to operational data.
With the help of a centralized dashboard through TRA’s WIMS, an operator at one of TRA’s regional facilities was able to reduce the amount of chemicals in the solids process. The dashboard provided a field that summarized Key Performance Indicators. With this, the operator was able to quickly see the results of tweaking the process. He allowed for a longer decanting schedule, which resulted in improvements to solids settling and, subsequently, lower polymer use.
“Seeing the data immediately and in a visual context makes it much easier to adjust things daily,” said Naranjo. “Optimizing chemical usage daily saves us money by increasing the efficiency of plant operations. The composition of our influent can change daily, so having this level of granular detail allows us to be more proactive and achieve efficiencies wherever possible. That can really add up to significant savings over time, which is directly passed on to our customers.”
A flux curves modeling feature in WIMS can be used to trend mixed liquors, ensuring sufficient return and wasted sludge flow rates, allowing the process to be fine-tuned at any time. Generally, a rule of thumb is to maintain the bottom sludge blanket not more than a quarter of the clarifier.
Triggers can be set to alert operators to anomalies of concern or any type of event that an operator wants to be notified about. These can be selected to display on the dashboard so decision-makers can easily view the data and make informed decisions on day-to-day operations. Role-based access controls allow users to view all data, fostering collaboration, while restricting editing privileges to only those departments and individuals based on their role. This bolsters data integrity by ensuring truthfulness and safeguarding against manipulation.
Committed to sustainable operations
By using WIMS, TRA is streamlining processes, conserving resources, reducing waste and minimizing its environmental footprint when it comes to water and wastewater treatment operations. This approach promotes sustainable practices, energy efficiency and responsible resource management in every aspect of the organization.
The primary objective was to revolutionize traditional plant operations by harnessing digital technology, thereby enhancing the processes of data collection, analysis and decision-making. However, by taking a holistic approach, the authority is also fostering a culture of environmental responsibility and leadership, and it encourages others in the sector to adopt similar strategies.
“This project has gone beyond meeting regulatory requirements and operational efficiencies; it has cemented our commitment to environmental sustainability,” said Naranjo.
About the Author
Erik Larsen
Erik Larsen is product marketing manager for Aquatic Informatics. He is a digital solutions expert with a special focus on AI and machine learning, data and analytics, and managed services.