About the author: Alberto Quiroz, P.E., is master planning manager for Suez North America. Quiroz can be reached at [email protected] or 201.634.4202.
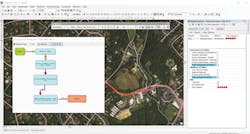
The decision tree flow chart asked questions about risk category, pipe attributes and other criteria not used in the risk calculation.
The investment is massive and the stakes are huge: Over the next five years, water services company Suez North America plans to invest as much as a half-billion dollars to repair or replace thousands of miles of water and wastewater pipe. But pinpointing these buried assets is no easy task. Without the right tools, it can be like finding a needle in a stack of needles.
That is why Suez’s corporate and local engineering teams have been performing risk-based rehabilitation and replacement planning studies.
Risk-Based Assessments
The studies use an ArcGIS-based asset management and capital planning software tool, known as InfoMaster, to calculate the risk of replacing or repairing pipes, or leaving them untouched. Once the risk is assessed, projects can be prioritized.
So far, risk-based prioritization has been implemented at three of Suez’s utilities (Idaho; New Rochelle, N.Y.; and northern New Jersey) and three sites where the company operates and maintains the system for a municipal partner (Long Island, N.Y.; Jersey City, N.J.; and Bayonne, N.J.) for a total of 7,300 miles of network.
The studies allow Suez to justify specific investments. They also allow potential project areas to be mapped and for that information to be shared with other utilities doing work in the service area. In turn, this minimizes disruptions and reduces paving costs.
The assessment uses a five-step process developed by the corporate and engineering teams. The steps are:
- Data collection and analysis;
- Likelihood of failure (LOF) and consequence of failure (COF) configuration;
- Risk scenario;
- Rehabilitation and budget plans; and
- Local use.
The risk score for each pipe was calculated by multiplying LOF and COF. LOF and COF can be highly system-specific, depending on the issues in the system and the availability of data. LOF was estimated using factors such as material, diameter, pressure zone, service requests and break frequency. COF was quantified using diameter, proximity to critical customers, type of road and proximity to water bodies. The results were summarized in a risk matrix to categorize and prioritize each pipe segment. In order to simplify interpretation, the risk scores were classified in five risk categories ranging from very low to very high.
Analyzing Scenarios
For each system analyzed, multiple risk scenarios were evaluated by changing the weights associated with LOF and COF criteria. This allowed Suez to perform sensitivity analyses and identify the most important criteria to standardize the process while still taking into account local considerations. The results for multiple risk scenarios were reviewed and a workshop was conducted to establish the final weights for each criterion.
Once the final risk scenario was selected, a rehabilitation plan that provided a recommended action for each pipe was developed. This was performed through a detailed decision tree flow chart in which a series of questions was asked to identify the appropriate action. The questions in the decision chart focused on risk category, pipe attributes and other criteria not used during the risk calculation, such as hydrant test results, paving schedule data and previous rehabilitation. This helped identify pipes that need special consideration despite low risk scores.
The integration with GIS allows for a more precise analysis using external and internal data, and also allows users to trace back the path taken by any pipe in the decision tree. This feature helped teams review the results and increase the transparency of the decision. The results from the risk calculation and rehabilitation planning were stored in geo-databases that can be easily analyzed in GIS for further review.
The results helped the local engineering team identify areas of concern and easily update their annual capital plan. The identification and prioritization can be updated as needed or as new data (e.g., municipal paving plans, other utility work, etc.) become available. Results from the hydraulic models also can be incorporated into the analysis when available.
These risk-based assessments have helped Suez’s corporate and local engineering teams make data-driven decisions when selecting piping projects. The integration with GIS has allowed Suez to increase transparency with upper management and economic regulators. Implementation of InfoMaster has proven to be a low-cost solution to streamline the capital planning process for underground assets. The process to develop and implement this risk-based asset management approach has been easily transferred across business units.