Detecting Leaks With Satellite Imagery
About the author:
Paul Gagliardo is senior technical fellow for Utilis. Gagliardo can be reached at [email protected].
Water utilities across the country struggle with aging infrastructure that results in water loss from leaks. The cost to rehabilitate or replace pipe often is greater than the cost of repairing leaks. Utilities tend to wait for customer-generated work orders before acting. This typically occurs when a leak surfaces after a long-standing period of water loss and possible infrastructure damage has occurred.
While reported leakage tends to be associated with surface expression of water, background leakage and unreported leakage are more difficult to detect and manage. The significant loss of drinking water before it reaches the customer is especially critical in California’s drought. Additionally, the value of lost water is compounded by the energy required to treat and convey it.
In the hope of finding ways to save energy used in water conveyance, the California Energy Commission funded a grant in 2016 to study the development and deployment of technologies that detect water leaks in residential, commercial and industrial areas and to prevent water loss in water-conveying systems. One of the technologies tested was the Utilis satellite imagery solution.
Non-revenue water (NRW) typically is modest in California—less than 10%—due to the relatively young age of utility pipes. The majority of this leakage is background and often small leaks that run undetected for long periods of time before surfacing. The major costs to a utility due to leaking pipes are loss of scarce resources, pumping and distribution, electricity, and treatment costs.
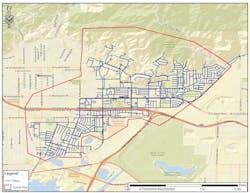
California American Water (CAAW), an affiliate company of American Water, was selected to test the leak detection technologies, and Duarte, Calif., was chosen as the test location. The Duarte system is in Southern California, just east of Los Angeles. The distribution system is comprised of approximately 100 miles of mains, and the supply is primarily provided by groundwater wells scattered throughout the service area. Drinking water is served to customers through multiple pump stations and pressure zones. The pipe mains are a mixture of steel, asbestos cement and plastic. Reported water leaks have historically averaged 60 per year, but 87 main break repairs occurred in 2016. 2017 saw this number almost double to 161 main break repairs. Total system delivery in 2017 was 1,815 million gal per year or an average of 4.98 mgd. NRW leak volume was reported to be 15.7% in 2017, or 285 million gal per year, or an average daily loss of 0.78 mgd.
Beginning in May 2017 and continuing for 12 months through May 2018, Utilis collected and analyzed satellite images to determine likely leak location points of interest (POI). A GIS-based map report was provided to CAAW subsequent to each image analysis. CAAW used this report to direct leak detection field crews to specific locations to inspect for leaks.
Some locations contain more than one leak due to the fact that the Utilis image analysis looks for the result of a leak—such as wet soil—as opposed to the leak itself. More than one leak can contribute to an area of wet soil that is detected by the satellite image. Nine of the Utilis identified POI’s generated the discovery of two leaks each when inspected, while three POI’s generated the discovery of three leaks each. In total, 79 leaks were identified pursuant to the inspections directed by the Utilis satellite image analysis.
This results in a performance metric of 0.69 leaks per site investigated. In addition, 17 of the POI’s were deemed to be “suspect” due to the fact that an acoustic signal could be heard at the location, but it could not be correlated. Further investigation can be performed to determine if a leak is present. A total of 33 inspected sites (29%) were deemed to be “quiet” and no leak was found or is expected to be found.
More than 500 POI’s were identified during the year-long study period, and 56 POI’s were inspected either by CAAW field leak detection crews or correlated with work orders evaluated by CAAW staff. At these 156 sites, 121 leaks were found. The POI’s were compared to WO from CAAW in Duarte to determine additional sites that yielded leaks, but were not part of the cohort that was inspected by CAAW field crews as part of the study. A total of 42 WO sites were found to correlate with a Utilis POI.
The number of total POI’s identified during the 12 deliverables was 504. During the course of the study no other POI’s overlapped with these 65. Nine of these POI’s were investigated by CAAW and Utilis, with four yielding leaks, one suspect and four quiet.
Conversely, 439 POI’s did overlap with at least one other POI during the 12-month project. The overlapping POI cluster can be related to work orders in a temporal manner to forecast when leaks will arise, where they will be located, and how long they will exist before surfacing and becoming visible. A 50-meter buffer zone around a POI was used to define a cluster. The large blue circle is the cluster zone while the red smaller circles are POI buffer zones, which make up the cluster. The blue dots are Utilis leaks, the yellow are work orders.
During the first four months of the project, no POI’s were recorded in this area and only one work order was generated in the first month. In September and October, four POI’s were found along with one leak. A work order was generated in November resulting in a second leak being found and repaired. Two POI’s were identified in December corresponding to four Utilis identified leaks. In March and April 2018, POI’s appeared and leaks were subsequently found by Utilis in May. The timing of the POI’s, work orders and leaks found suggests a correlation between the satellite image and a new non-surfacing leak.
The work orders that fell within seven days prior and 180 days after the Utilis image were counted as a positive correlation. Utilis observed the soil moisture remains elevated up to seven to 10 days after a leak has been repaired. Therefore, if a work order was generated up to seven days before the satellite image showed a likely leak, it was considered a verification of the POI.
AWWA Manual M-36 states that background, non-surfacing and not reported leaks can last for multiple months. A leak could last six months or 180 dayswithout being reported and thus would be counted as a positive correlation. As can be seen, a work order leak was found in July and a Utilis POI was generated in August 2017, and then all was quiet for four months.
Over the course of the next five months there were five POI’s and four leaks found pursuant to Utilis driven inspections. No work orders were generated for this cluster area during that period of time, thus none of the leaking pipes were noticed or surfaced. Three times during this period, Utilis directed crews inspecting the area and found leaks. It is clear background leaks can remain sub-surface for long periods of time and thus go undetected.
In conclusion, the Utilis technology performed well at locating non-surfacing, background leaks in the Duarte, Calif., utility district. It has been shown that this technology can identify leaks at a high rate in a short period of time. The technology identified early stage leaks and tracked their progress over time until they surface and become work orders.