How To Compare Sewer Technologies Using Lifecycle Cost Analysis

About the author: Tyler Molatore, P.E., is municipal systems manager for Orenco Systems Inc. Molatore can be reached at [email protected] or 541.459.4449.
Pressure sewers can provide affordable service to municipalities, new subdivisions, and areas where gravity sewers are difficult and expensive to install. Effluent and grinder sewers are today’s dominant pressure sewer technologies. When evaluating these two options, lifecycle cost analysis is an effective tool for comparison, especially when actual costs can be used.
In 2010, the Water Environment & Reuse Foundation (WERF) developed two reliable resources for evaluating sewer technologies: a Wastewater Planning Model, allowing users to compare lifecycle costs; and a series of collection system fact sheets for different types of sewers, including design characteristics, performance and cost estimates. When performing lifecycle cost analysis using WERF’s documented figures, it is evident that pressure sewers can be an affordable option.
1. Understand the Basics
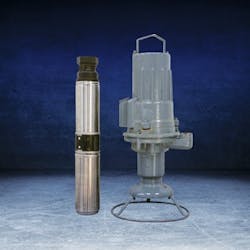
Pressure sewers generally use 2- to 4-in.-diameter sewer mains, without manholes, that follow the contour of the land below frost depth to deliver wastewater to a treatment facility or to a neighboring city’s existing sewer. Effluent sewers collect, settle and provide anaerobic digestion of solids in 1,000-gal on-lot tanks. Primary clarified wastewater from the tank’s clear zone is filtered by a 1⁄8-in. mesh screen and then pumped by a 115-VAC, ½-hp high-head pump weighing about 30 lb. Because the tank collects the majority of solids, grease and oil, scouring velocities and lift stations typically are not required.
Grinder sewers collect wastewater and solids in 70- to 100-gal on-lot basins. Everything is ground into slurry and pumped away by 230-VAC, 1.5- to 2-hp grinder pumps, usually weighing more than 80 lb. Because solids, grease and oil can build up on the interior of the transport lines, grinder sewer mains require a minimum scouring velocity and often need lift stations.
2. Estimate Capital Costs
Capital costs for effluent and grinder sewers are generally comparable; the cost of the effluent sewer tank is offset by the cost of the grinder sewer pump. Effluent sewer tanks cost $800 to $1,200; the pump costs about $500. Centrifugal or progressive cavity pumps used in grinder sewers typically cost $1,500 to $2,500. According to WERF, installed costs for effluent sewer on-lot packages range from $3,000 to $5,000; installed costs for grinder sewer on-lot packages range from $4,800 to $7,200.

3. Estimate O&M Costs
Operations and maintenance (O&M) costs typically include expenses for preventive and reactive maintenance plus equipment repair and replacement (R&R). For certain collection systems, R&R can be a significant portion of total O&M expenses, so it is important to evaluate expected product lives and available warranties for each major component, including pumps. Incorporating extended pump warranties (10 or more years) into the project’s specifications can help uncover the true long-term cost of pumps. Effluent sewer pumps cost about $500, are field-repairable, and can last longer than 25 years. Grinder pumps range from $1,500 to $2,500. They generally need repairs every eight to 10 years at a typical cost of about $800 and usually require replacement every 16 to 20 years. Using WERF’s fact sheets, O&M costs for effluent sewers are estimated to be $56 to $84 per year per connection. O&M costs for grinder sewers are estimated to be $120 to $240 per year per connection.
4. Consider Solids Management Costs
All wastewater systems have solids management costs, but in different amounts and at different stages of the collection and treatment process. Effluent sewer solids are managed on-lot through long hydraulic retention times, passive anaerobic treatment and infrequent tank pump-outs. The pump-out interval for a home with three residents and a 1,000-gal tank is estimated to be approximately 11 years at a 95% level of confidence. If pump-outs occur every 10 years at a cost of $300 (and a 1.5% discount rate), the equivalent annual pump-out cost is about $28 per year per connection. In a grinder sewer, all solids are pumped to a treatment plant. The larger volume of solids requires a larger solids processing system, resulting in a higher cost of treatment. Solids (i.e., waste-activated sludge) from treatment plants serving grinder sewers are typically three times greater by weight than solids from facilities serving effluent sewers.
5. Calculate Net Present Value
Calculating net present value (NPV) is an important part of evaluating the lifecycle costs of various technologies and establishing operations budgets based on anticipated capital and operations expenses. Capital investments for wastewater infrastructure involve an initial expense for equipment installation and ongoing expenses for O&M and R&R. NPV calculations convert these costs to their present value, allowing equivalent comparisons between technologies.
When calculating the NPV, the lifecycle planning period should reflect the number of years that all major components of the sewer system are expected to last before needing replacement. This is usually a minimum of 30 years.
Begin the calculation by converting annual O&M costs (including R&R) to present-day dollars, using a uniform series present worth equation (USPW):
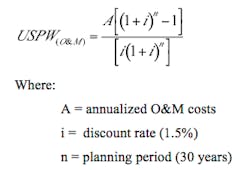
The high-end USPW(O&M) estimate for effluent sewer is $2,017:
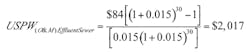
The high-end USPW(O&M) estimate for grinder sewer is $5,764:
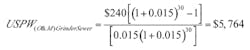
Next, calculate NPV by adding the capital cost of the technology to the USPW:
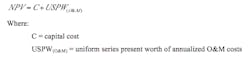
The high-end NPV for effluent sewer is $5,000 + $2,017 = $7,017. The high-end NPV for grinder sewer is $7,200 + $5,764 = $12,964. Using this same process to analyze the cost of gravity sewer shows that it typically has an even higher NPV.
Affordable wastewater solutions for municipalities often have been hard to come by. A long-time roadblock to the application of cost-effective alternatives, like pressure sewers, has been a lack of reliable information about their cost. In conjunction with the Wastewater Planning Model, WERF’s fact sheets give municipalities and engineers the tools they need to effectively compare the complete life-cycle cost of various technologies.