Isotopic Fingerprinting: Tracing Sources of Nitrate Contamination in Water
Nutrients are naturally present in the environment and are essential to ecosystem health in low quantities and moderation. High levels of nutrients such as nitrate in ground and surface waters, however, present environmental, economic and health concerns. In order to understand water quality issues, isotopic fingerprinting can be used to track the source of excess nitrate. Furthermore, utilizing a multi-isotope approach through analysis of nitrate and boron isotopes allows for isolation of the source of contamination.
What is Nitrate?
Nitrate is a naturally occurring ion composed by three oxygen atoms and one nitrogen atom (NO3-). There are two sources of nitrate: natural and artificial. Natural nitrate is formed by nitrogen-fixing bacteria process and it can be found in soils, effluents and surface waters. Whereas artificial nitrate is produced commercially for a variety of purposes, including cured meats preservation and in the production of fertilizers.
Regardless of the source, an excess of nitrate in water bodies can have serious consequences and lead to nitrate pollution. The National Ocean Service defines nutrient pollution as the process where too many nutrients, mainly nitrogen and phosphorus, are added to bodies of water.1,2
In recent years, nitrate pollution has become an important topic and governmental agencies are working to address this problem. A study conducted by the U.S. Environmental Protection Agency revealed that 20% of U.S. lakes have levels of nitrogen pollution and around 15,000 water bodies have nutrient-related impairments.3
Why are Elevated Levels of Nitrate a Concern?
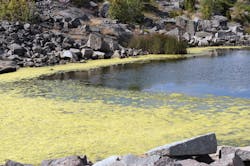
High levels of nitrate in agricultural runoff, nitrogen-based fertilizers, animal manure, and sewage may lead to consequences that affect the environment, economy, and health. Within water bodies, the amount of nitrate present plays a role in limiting the growth of algae and other plants. However, since excess nitrate acts as a source of fertilizer for algae, high levels of nitrate in water will cause an increase in algal growth. The resulting algal blooms block sunlight and create anoxic zones or dead zones that are unable to support marine life.4,5
Algal blooms have an adverse effect on environmental habitats, leading to losses in biodiversity and food web changes. In terms of economic consequences, excess levels of nutrients can result in loss of recreational activity. For example, due to harmful algal blooms causing beach and lake closures, commercial fishing sectors and tourism are negatively impacted.
In addition, human health is also affected by nutrient contamination in drinking water. According to the EPA, infants who drink water with high levels of nitrate (10 MCL or higher) can suffer illnesses, including blue-baby syndrome and shortness of breath. The effects can vary depending on the type of nutrient, these include stomach and liver issues, respiratory conditions, and neurological effects.6
As previously mentioned, elevated levels of nitrate can be found in a variety of environments. A deeper understanding on the source contamination will help water managers to mitigate this problem. There are two types of source contamination: point source or nonpoint source. Point sources of pollution refers to sources of contamination derived from one influence. These are identifiable and easy to track because the nutrient waste travels directly from source to water. On the other hand, nonpoint sources are derived from different sources such as waste from urban/suburban developments as well as agricultural and household fertilizers. Nonpoint sources are difficult to regulate since it varies depending on the season and precipitation.7
In order to properly manage nutrient contamination in water bodies, determining the source of the nutrient pollution and tracking the movement of pollution through the environment is critical.
Applying Nitrate Source Tracking
Water quality managers are struggling to pinpoint where excess nitrate in water bodies is really coming from. Coastal waters such as the Gulf of Mexico, for example, are experiencing issues as a result of algal blooms and dead zones. Both agricultural runoff and urban runoff are potential contributors to high levels of nitrate that create dead zones in coastal water bodies.8
By applying nutrient source analysis following a contamination event, water managers can track the source of the contamination, allowing for confidence in remediation plans. For example, measuring the levels and isotopic values of nitrate [oxygen (δ18O) and nitrogen (δ15N)] in water samples provides results that can determine whether excess nitrate comes from animal manure, sewage, nitrogen-based fertilizers, agricultural sources, natural sources, or atmospheric deposition.9
Furthermore, the measurement of oxygen (δ18O) and nitrogen (δ15N) isotopes over time can provide insights about the occurrence of denitrification processes since it affects nitrate and its isotopic signature. Due to this, the results of oxygen and nitrogen may help to identify the occurrence of denitrification processes.10
The combination of oxygen and nitrogen isotopes of nitrate in water samples can be used to trace the source of nitrate in water across the environment. However, it can be challenging to pinpoint a single contamination source. This limitation can be overcome through the application of boron isotopes which can help isolate the source of contamination even further.
Using Boron to Enhance Nitrate Source Tracking
Boron, which naturally occurs in two isotopes, 10B and 11B, is released in the environment from weathering of rocks, the circulation of boron in the biogeochemical cycle of land plants, and is present in ground and surface waters. When boron enters the environment, it develops a very specific isotopic signature that allows for identifying the source of the excess anthropogenic boron. Boron is widely used in detergents, cosmetics, agricultural products and is present in animal manure. As a result, there is a wide range of boron isotope ratios (δ11B) and sources.11
When it comes to identifying and quantifying the sources of nitrate in water, boron plays a key role due to the limitations in the measurements of the δ18O and δ15N alone. For example, fertilizers, soil, manure and sewage have characteristic nitrate isotopic signatures but the ranges overlap greatly, which makes it challenging to identify discrete sources.
Additionally, the differentiation between manure and sewage becomes difficult since the characteristic nitrate isotopic signatures for these sources are indistinguishable. Lastly, natural denitrification and mixing processes involving nitrogen compounds impact the isotopic signature.12
The application of boron as a complimentary tracer allows for clarification of contamination sources. Using the combination of triple isotopic ratios (δ11B, δ15N, δ18O) is a powerful technique for tracing contaminant sources since boron is not affected by natural processes involving nitrogen compounds like denitrification.
Boron is concentrated in most nitrate contaminant sources, which reveals distinct isotopic signatures for wastewater and animal manure. Thus, water quality managers can use boron to distinguish sewage from animal waste which is not possible through nitrate analysis alone. In addition, the δ11B measurement of different sources can differentiate between industrial and agricultural activities.12,13
Conclusion
Understanding water quality issues at their source is vital for mitigating nutrient contamination. Isotopic fingerprinting can be used to differentiate sources of contaminants within watersheds and water management systems. Measuring δ11B, δ15N, δ18O in water samples can help identify the source of contamination since different sources of nitrogen and boron have known isotopic signatures.
The application of boron isotopic ratios enhances nitrate source tracking by providing crucial data of the source of contamination that nitrate analysis can not identify itself. The triple isotopic combination provides valuable results necessary to address the primary causes of contamination in addition to finding the right solutions to manage and mitigate nitrate contamination of water bodies.