Level monitoring doesn’t just have to catch blockages
Key Highlights
- Traditional sewer cleaning schedules are often based on historical data or inherited routines, leading to over-maintenance and unnecessary costs.
- Bellevue implemented radar sensors to measure actual buildup intervals, allowing for tailored cleaning schedules based on real asset conditions.
- Continuous monitoring revealed that many lines were cleaned more frequently than needed, saving crew time and reducing pipe wear.
- Sensor data also uncovered early signs of inflow and infiltration, enabling targeted repairs and better management of groundwater intrusion.
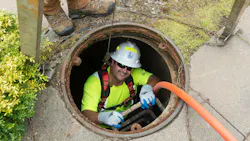
Most sewer collection systems in the United States are cleaned on a calendar that is based on past blockage history or an inherited schedule.
A line is jetted on its set schedule, perhaps monthly or quarterly, on an interval set years ago and possibly never questioned since. The logic is sound enough without better information: cleaning prevents blockages, and a blockage that becomes an overflow brings regulatory and public consequences no utility wants. But did that section of network actually need cleaning?
That gap matters more as budgets tighten. Wastewater infrastructure earned a D+ on the 2025 ASCE Report Card, and the EPA's most recent Clean Watersheds Needs Survey put the 20-year investment requirement for wastewater and stormwater at roughly $630 billion, a steep rise on the previous survey.
Utilities are being asked to maintain aging networks with the crews they already have. Cleaning that runs on habit rather than need is one of the first places that strain shows up.
A schedule built on habit not data
The City of Bellevue, Washington runs about 600 miles of sewer main. For years it cleaned a large share of that network on fixed intervals that came from history rather than measurement, with some lines jetted as often as once a month. A single wastewater senior engineering technician oversees the program, and four crew members handle the field work day to day. In total the city was putting roughly 255,000 feet of pipe through recurring cleaning each year. At about $0.98 a foot, that came to close to $250,000 annually, before any reactive work.
A guessed interval carries risk in both directions, and a utility rarely knows which way it is wrong until something happens. Clean a line too rarely and it blocks, bringing the overflow and the after-hours callout. Clean it more often than the pipe needs and the cost is harder to see: crew hours spent on lines that were already clear, and wear from repeated high-velocity jetting, which scours the pipe wall and shortens the service life of the asset.
Measuring the real interval
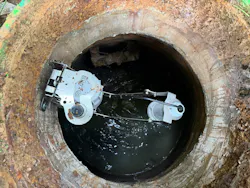
Rather than keep adjusting frequencies by feel, Bellevue set out to measure them, starting with the assets that generated the most work. The city installed radar level sensors on those lines using the Captis Sewer Monitoring Kit, which pairs a Captis S2 logger with a radar sensor that reads liquid level continuously without contacting the flow. Because the radar sits high in the riser, crews could fit the units to live, high-maintenance lines without confined space entry and without cutting into the pipe.
The method is straightforward. A line is cleaned, then left under a sensor so the level record shows how long buildup takes to return and begin restricting flow. That measured interval, specific to the asset, becomes the basis for the next cleaning in place of the figure carried over from the old calendar.
Readings feed into the Kallipr Kloud platform, where the team can follow a line's behavior across weeks and months instead of inferring it from an occasional site visit. Establishing a dependable interval on a single asset takes several months of continuous data, so the program builds slowly and by design.
What the data showed
The early results ran against the way the program had always operated. On the assets reassessed so far, Bellevue has extended cleaning from every six months to once a year, and the lines that had been jetted monthly are next for the same review. None of the reassessed lines have blocked on the longer interval.
The broader finding was that the city had been cleaning more often than its network required, and that the over-maintenance was costing Bellevue in two ways it had not been tracking. The first was crew time. Four people are responsible for the entire 600 miles, and every jetting run that did not need to happen was a day those crews spent away from work that did. The second was the condition of the pipe, worn down a little by each unnecessary pass. For a small team under constant demand, recovering either one changes what the week looks like.
A second signal: Inflow and infiltration
The sensors also recorded behavior that the cleaning question would never have surfaced. At two locations, flow rises in the early hours of the morning, a period when a collection system should be running at its lowest of the day. A cleaning calendar has no way to reveal a pattern like that, and it is not something a resident would report. To anyone who works on inflow and infiltration, an early-morning rise with no obvious source reads like groundwater entering the pipe.
Inflow and infiltration is the larger prize across the sector. Clear water that enters a collection system through cracked pipe and failing joints is treated at full cost despite never belonging there, and at some plants it accounts for as much as half of annual flow. The persistent difficulty has always been locating where it gets in. Continuous level and flow data, read across both wet and dry weather, is one of the few practical ways to narrow a catchment down to the areas that are actually leaking, which turns an I&I budget into a set of targeted repairs rather than a broad guess.
Beyond the blockage
Cleaning frequency and infiltration are two readings of the same underlying record, and they are not the only ones. Once a utility is logging level continuously across its network, other questions become answerable. The data show how a catchment responds to a given rainfall and how fast, and they show where surcharge starts to build in a reach well before it would reach the surface. Assets that sit closer to capacity than the assumptions of the hydraulic model become visible.
A schedule that keeps pace with the network
A measured schedule is not a set-and-forget exercise. Even a network cleaned on perfect intervals today drifts over time, as the properties and channels feeding each line change with redevelopment and shifting flows. Left unreviewed, and without data reporting continuously, a schedule can clean lines more than they need and others less than they should.
None of this was practical until recently, when field devices lasted months rather than years and every reading meant a return visit. The radar units Bellevue deployed are built to run for up to 10 years in a submerged pit on a single battery, which makes it realistic to leave a line instrumented for the long term and let the schedule move as the network does.
A template for stretched utilities
None of this depends on Bellevue being an unusual operation. Most utilities are running older networks with fewer people than those networks realistically need, under budget and permit pressure that is not letting up. Under that load, the path of least resistance is to keep cleaning on the established calendar and trust that the intervals are close enough. Bellevue's experience is a fair warning that the intervals are often wrong, and that the error usually runs toward doing too much.
Measuring the true interval on the assets that drive the most maintenance turns a fixed schedule into one a utility can defend with data, and it lets a small crew spend its hours where the network actually needs them.
The work at Bellevue is not finished; the sensors continue to move through the system, establishing one interval at a time. What Bellevue's experience shows is that sewer level monitoring earns its place well beyond catching the next blockage, provided the data behind it is continuous and reliable enough to act on.
About the Author
Gerhard Loots
Gerhard Loots is the Chief Executive Officer of Kallipr, an industrial IoT company specialising in remote monitoring solutions for water and wastewater networks. He has more than 20 years of experience leading technology and innovation programs across the utilities and telecommunications sectors and is passionate about helping organisations use data to improve environmental outcomes.