Micro-Detecting I&I After a Single Rain Event
Locating inflow and infiltration (I&I) is a time-consuming and costly endeavor. Since 80% of I&I resides in 20% of the collection system, the key to success is to micro-detect the areas contributing the 80% as quickly as possible. Low-cost iTracking technology is able to pinpoint areas of I&I after a single rain event without the requirement for confined-space entry, sensor maintenance or time-consuming data retrieval.
Working with Hazen and Sawyer’s engineering team, iTracking’s I&I micro-detection ability was recently proven in a pilot project initiated by Jefferson County, Ala., in February 2018.
The Solution
The area selected for the pilot by Jefferson County and the Hazen and Sawyer engineering team for being one of the basins responsible for contributing the greatest amount of I&I was designated as “Turkey Creek TK2B.” Officials decided to initially place 14 iTracker sensors within the 22 linear miles comprising the TK2B basin. The project was scheduled for completion in three phases during what was to be a six-month pilot project. However, with only 14 iTracker sensors, the pilot was completed in 3½ months, with actual man-hours expended on all three phases—including developing analytical reports—totaling just 48 hours.
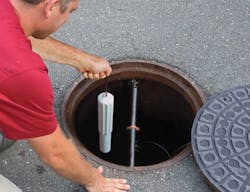
Phase I: On February 7 and 8, 2018, 14 iTracker sensors weighing just under 2 lb each, without the requirement for confined-space entry, were installed at strategic locations along the 22-mile TK2B basin. On average, it took 20 to 30 minutes to locate each manhole and 15 minutes to install each sensor. The entire installation process was completed in less than 10 hours.
Phase II: On March 16, after a few rain events, data was simply and safely collected from each monitored site via smartphone Wi-Fi connectivity. Data from the 14 sites was imported into the iTracking analytical software program in order to determine those basins responsible for contributing the greatest amounts of I&I. With the click of a button, a bar graph (see Graph 1) was automatically developed detailing rainfall-derived inflow and infiltration (RDII), groundwater, base and total I&I contributions in gal per minute for each monitored site. It was quickly determined that Mini-Basin 7004-002 was responsible for the highest volumes of RDII.
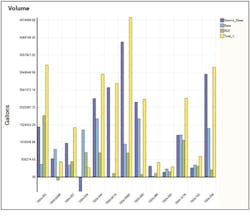
Below is a summary of the results of phases I and II, detailing the calculated RDII volume for each mini and micro basin over the study period.
In order to prove the I&I micro-detection capability of iTracking’s technology, Site 7004-002, exhibiting the greatest volume of RDII, was scheduled to be divided into 11 micro-segments for the next evaluation period.
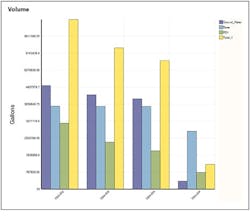
Phase III: In order to further isolate the source of I&I entering the system, 11 iTracker sensors were strategically placed upstream of Site 7004-002. Officials quickly concluded that an area directly upstream of 7004-002 consisting of only four manholes alongside a creek was responsible for contributing the majority of RDII (see Graph 2). iTracker sensors were placed in each of the four manholes, making up the 870 ft of micro-basin 7004-002. Evidence of major infiltration was discovered along the 7004-002 15-in. ID micro-basin, with the majority entering between two adjacent manholes (002 and 003). Cameras immediately were dispatched, and officials quickly determined that the large volumes of I&I were due to faulty laterals entering the 7004-002 micro-basin between manholes 002 and 003.
With just 48 hours of actual field and analytical reporting time expended and the ability to obtain concrete results after single storm events, Jefferson County, in conjunction with Hazen and Sawyer, were able to cost-efficiently evaluate 22 miles of collection system piping all the way down to 14 mini and micro basins in just a 3½ -month period.
The Results
Upon confirmation of the findings from the pilot project, Jefferson County plans on remediating one of the areas exhibiting major volumes of I&I by lining both the main line and service laterals to the property line. In a second area where the main line previously had been lined, the county now has additionally lined the services to the property line.