Assessing Water Variability
A water utility in Ohio wanted to learn more about the variability of water quality parameters such as pH, ORP, turbidity and chlorine. Previously, most of these parameters had been measured by spot sampling protocols with only a few measurements during a daily period.
The City of Columbus Division of Water utility has three water treatment plants located in Franklin County that serve the growing central Ohio area. The utility currently serves more than one million
The Water Quality Assurance Laboratory at the Division of Water was particularly interested in tracking the variability of water quality parameters in its system. The lab is one of the most modern water quality research laboratories in the water supply industry. Its certified personnel perform thousands of tests each year and provide data regarding water quality, treatment and microbiological testing. In order to more accurately assess the water variability, the utility used a YSI 6920DW drinking water multiprobe.
The YSI 6920DW is based on YSI’s 6-Series multiparameter sonde, which has been utilized for the long-term continuous monitoring of surface water in rivers, lakes, estuaries and the marine environment. The modification to produce the 6920DW for drinking water applications substitutes a free chlorine sensor for the 6920 dissolved oxygen sensor. In drinking water applications, there is great interest in the measurement of chlorine but little interest in oxygen.
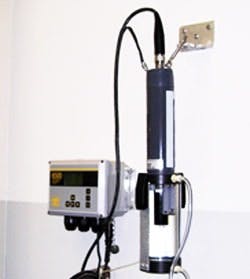
YSI 6920DW deployed at a water tower in Columbus, Ohio. The instrument, used in conjunction with a flow cell and a YSI 6500 process monitor, continuously monitors drinking water quality.
The YSI free chlorine probe has been extensively tested and shown to agree with DPD colorimetric measurements over a range of 0 to 3 mg/L as shown below.
For deployment at the Water Quality Assurance Lab, the YSI 6920DW was placed in a flow cell and water passed over the sensors at a rate of approximately 750 mL/min with the flow cell effluent delivered to a sanitary sewer drain. The parameters measured were temperature, pH, specific conductance, ORP, turbidity and free chlorine. Data was automatically logged for approximately 80 days to the internal memory of the sonde at 15-minute intervals and periodically uploaded and analyzed using YSI’s EcoWatch for Windows PC software.
Following this study at the plant, the utility was interested in obtaining similar data in its distribution system, with particular interest in determining the water variability at a water tower. The YSI 6920DW sonde was thus moved to a tower approximately three miles from the plant and installed with the flow cell tapped off the main water line which went into the tower.
In this location, the sampled water comes from two sources--the main distribution line from the plant when pumps are filling the tank or the tank itself when the pumps are off and the tank is discharging water into the distribution system. Again, data was collected at a 15-minute sample interval. As shown in the two data plots below, the free chlorine changes radically in discrete steps, a pattern which was not observed at the distribution plant.
The discrete changes are hypothesized to be due to the source of the water passing the sensors, either water from the main with high chlorine levels or water from the tank with lower chlorine levels caused by the detention time in the reservoir. Additionally, step changes were observed for conductivity in the tank deployment. This data pattern is due to the fact that high conductivity water was initially pumped into the tank prior to a rainfall event while the lower conductivity water is coming from the main after this parameter was decreased by rain at a later time.
The Columbus Division of Water invests significant resources in treatment and distribution systems to meet the demands of its expanding customer base. From these studies, the utility gained insight into the expected variation in key water quality parameters for drinking water. The data collected reassures the utility that the water provided to residents is clean and safe.