Centralize & Streamline
Justin Gray is a senior engineer and Patrick Fitzgerald is an environmental data analyst for the Louisville Metropolitan Sewer District. Chase Dabney is president and chief data analyst for Ethos LLC. Gray can be reached at [email protected]. Fitzgerald can be reached at [email protected]. Dabney can be reached at [email protected].
undefinedIn 2005, the Louisville Metropolitan Sewer District (MSD) entered into a regulatory consent decree that was later amended in 2009, requiring the mitigation of more than 200 sanitary sewer overflows and 103 combined sewer overflows.
In order to plan this mitigation effectively, a major expansion of wastewater collection system monitoring was necessary, as it serves as the foundation for accurate sewer modeling, project sizing and long-term regulatory compliance. MSD is responsible for the operation and maintenance of more than 3,200 miles of sewer collection system; 286 pump stations; and 20 water quality treatment centers. Stream water quality throughout Jefferson County is a primary focus, as is the operation of the 29-mile Ohio River Flood Protection System.
MSD manages environmental data collection from sewer and stream flowmeters, stream water quality monitors, rain gauges, a radar rainfall service, LIMS (laboratory sampling for water quality), pump stations, treatment centers, and numerous other field devices. The challenge always has been to simultaneously analyze multiple data sets housed in various databases on different servers. Consistent quality control of these datasets also was very time-consuming and difficult. MSD needed to create a system that would facilitate event analyses using these datasets, along with automation of data quality control to a reasonable level. This integrated data system would greatly increase MSD’s ability to analyze and trend the behavior of the storm water and wastewater systems for which it is responsible.
The utility had been using Telog Enterprise Client (TEC) software to receive remote sewer flowmeter data. As internal users became more familiar with the TEC interface and capabilities, the utility approached Telog Instruments hoping to partner in customizing the software to import the other environmental datasets in its system and to set up quality control measures.
Using the existing Telog Enterprise System as a base, the team successfully developed an application combining collected field data from disparate database sources, time synchronizing the data and working with the MSD ESRI GIS server to display both temporal and spatial data within one platform.
MSD now has instant, seamless access to more information than ever before, providing a broad user base with the ability to quickly analyze the system’s behavior at any given time or location and improving the overall quality of the datasets.
An Integrated Information System
When the data integration project began, MSD housed monitoring equipment at hundreds of locations, ranging from sites with full power and communication lines—which were mostly at MSD facilities—to remote sites with neither.
Because the remote monitoring system needed a substantial expansion in response to the consent decree, MSD needed to improve both data collection and site maintenance in order for internal staff to effectively handle the expansion without adding human resources. To achieve this, MSD selected battery-operated, data recording telemetry units (RTUs). Once installed, data is transmitted wirelessly to MSD’s system, where the flow data and battery levels can be monitored easily.
All of these RTUs transmit data directly into Telog’s Enterprise software. The ability of the software to receive data of all different sorts on widely varying timesteps—coupled with the powerful graphical user interface—resembled a system that MSD had been intending to build from scratch to tackle environmental data integration and quality control. The integrated system would need to include data from the many different platforms used to gather and store information.
Historically, MSD rain gauge, sewer and radar rain data came into different Oracle databases at its main office. Operations data was stored in the plant information database housed at its largest treatment center and could only be downloaded into Microsoft Excel spreadsheets for analysis. Stream gauge and water quality sonde data existed in Microsoft Access once it was received from USGS through a funding and data quality partnership, while the LIMS sampling data lived in a separate SQL server.
With this setup, MSD had no straightforward way to view and analyze information across databases.
A few highly experienced technicians had to collect the data from the various platforms and use independent spreadsheets, queries and databases to perform required analyses. This process was very inefficient and labor-intensive, and the risk of losing the ability to perform the analyses due to staff attrition was very real. Worse, staff had to copy and recopy data from several different places, increasing the potential for human error and inaccurate reporting.
A Centralized Approach
MSD decided to approach Telog about integrating this data into its existing TEC interface, without having to install hundreds of additional RTUs or perform a large-scale manual process to regularly synchronize the data. Telog agreed to help design a connectivity platform to help manage and analyze the data.
The result of this two-year effort was the Environmental Information Management System (EIMS), a platform that has centralized more than 20 years’ worth of data into one system that is continuously updated as data come in from monitors, gauges and pump stations throughout the MSD service area.
Using EIMS, users can access data from virtually all of MSD’s environmental sources. Whether the data arrives in an Oracle, Access, SQL, LIMS, SCADA or Pi format, EIMS imports, converts and integrates the data. MSD now has a comprehensive picture of everything in the system—more than 5,000 sites—and how they relate to one another.
One of the biggest improvements EIMS provides is the synchronization of time-stamped data from disparate sources. This allows MSD to see and correlate when irregularities take place, signaling a potential overflow or other event in progress. The various sites can be analyzed to establish normal function and behavioral boundaries. Rules can be defined around these boundaries and event notifications can be sent by e-mail or text alerting staff to investigate.
In addition, data security is of critical importance to water utilities, therefore the architecture takes this concern into account for specific data sources. For example, the SCADA data are received strictly via a push from the SCADA system; EIMS cannot initiate any communication with the SCADA system. Data arriving directly from RTUs cannot be edited or partially deleted. EIMS allows for the creation of additional measurements that can act as computations or alterations to RTU data, but the original RTU data always remains as it was originally transmitted. In this way, the disparate databases still serve their niche role within
New management platform helps Louisville utility with environmental data integration the environmental information Management system implemented by Louisville MsD centralized more than 20 years’ worth of data. It is continuously updating as data come in from monitors, gauges and pump stations throughout the MsD service area.
Geo-Data Integration
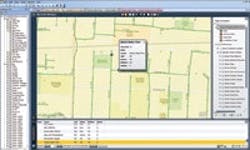
To facilitate the use of the integrated data site, EIMS has a read-only link to MSD’s GIS server, giving it access to MSD’s vast geo-database. This allows EIMS to spatially display all monitoring sites along with customized attributes. The ability to see the current flow through a manhole—or a lift station’s pump runtimes in conjunction with their location relative to the sewers and streams— has been extremely valuable.
To see the historical trend data associated with a site, users can click on the site and gain access to that location’s entire time history data. Data from other sites of all types can be added seamlessly and displayed on the same charts as the original site.
Pump station function can be observed, and possible impacts on surrounding areas can be analyzed. Stream samples can be viewed in conjunction with rainfall and wet well levels for any aberration in the pump station’s operation that could correlate to changes in stream water quality. The ability to view information so readily ensures quick problem identification and efficient solution development.
EIMS correlates environmental trend data, alarms and alerts with the physical locations that generated the data—enabling MSD to respond more quickly to potentially harmful situations and troubleshoot maintenance of the monitoring equipment. The system also gives easy access to years of historical data allowing powerful analyses to be set up using vast amounts of data, much of which was impractical prior to implementing this system.
Fulfilling the Consent Decree
MSD now has one centralized source for developing reports on the condition of many of its assets, including pump stations, sewer lines, regional water quality treatment centers and many other elements throughout Louisville’s wastewater and storm water systems. Using EIMS, MSD is generating reports and beginning to implement quality control rules that directly support reporting and compliance objectives outlined in the consent decree and its MS4 permit. EIMS reporting capabilities range from simple graphical and tabular representations to completely customizable and highly complex Crystal Reports, using the built-in Crystal Reports viewer. Louisville MSD is not the first utility to require this kind of information management system. The integrated data system is a cost-effective, powerful and customizable tool that has been molded to fit around various software and database applications that MSD will use far into the future.
Download: Here